In this article, we’ll discuss the Python Pandas library. We’ll go through its theoretical part and also we’ll practically discuss some of its functions with Python code examples.
What is Python Pandas?
It’s a very popular library that is also open source. The role of this library is the manipulation of data, organization, and analysis. Cleaning, loading, analyzing, and transformation of data are efficiently performed by Pandas library. If you want to work with structured data(tables, spreadsheets) efficiently, then Python Pandas is for you because it provides functions and powerful data structures. For statistical analysis, data preprocessing, and data exploration, you can make use of pandas.
It also provides its user with a large number of data manipulation methods, grouping, filtering, and many more.
Data Science and Machine Learning use Python Pandas
Its reputation for making data-related tasks easy is the reason why data science and machine learning use it. It can also be used for research.
Features of Pandas Library
- Label-based indexing and slicing with intelligence
- Joining datasets and merging with high performance
- For various file formats, it provides data input and output tools
- Built-in time series functionality
- Alignment of data and handling of values that are missing
- Flexible reshaping and dataset pivoting
Importing Pandas
pip install pandas
This is the command that we can use to install the pandas’ library in our system. You can use the cmd of the terminal of your compiler to run it.
import pandas as pd
This is how you can use/import pandas in your file. The ‘pd’ is the short name, you can give any name of your choice.
Data Structures of Pandas
Its 2 main data structures are as follows:
- Series (for one-dimensional data)
- DataFrame (for two-dimensional data)
1. Series
A series is a 1D(one-dimensional) array that can store items of different datatype. Value and labels(index) are what they consist of.
Creation of Series
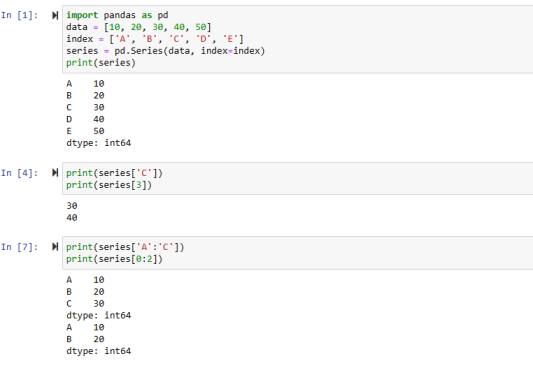
import pandas as pd

data = [10, 20, 30, 40, 50]
index = ['A', 'B', 'C', 'D', 'E']

series = pd.Series(data, index=index)
print(series)
Output
A    10
B    20
C    30
D    40
E    50
dtype: int64
In this example, we have two Python lists that will be used as values and labels(index). We then used the series function of the Pandas library and passed it the values and index list. The output shows the 1D array created using the series function.
Accessing Elements from Series(label and index)
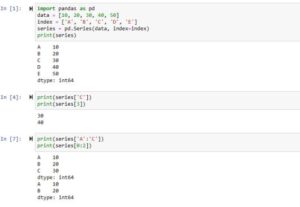
print( series['C'] )
print( series[3] )
Output
30
40
In this code, we fetched the value using the label. Also, we used the indexing method to fetch the value at index 4(index starts from 0 so, 0,1,2,3).
Slicing in Series
print( series['A':'C'] )    # labels
print( series[0:2] )        # indexing
Output
A    10
B    20
C    30
dtype: int64
A    10
B    20
dtype: int64
We can specify a range which we want to take in series. We can specify it using labels and indexing. In the first coding example, all the values from A to C will be taken. While in the second example, the ending point(2) will be subtracted by 1 like (2-1) so it means values from index 0,1 will be taken.
2. Dataframe
A data frame is specified as a 2D data structure that can have columns of different datatypes.
Creation of Dataframe
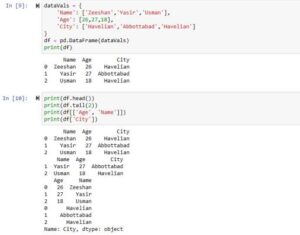
dataVals = {
'Name': ['Zeeshan','Yasir','Usman'],
'Age': [26,27,18],
'City': ['Havelian','Abbottabad','Havelian']
}

df = pd.DataFrame(dataVals)    # creating dataframe
print(df)
Output
      Name  Age        City
0  Zeeshan   26    Havelian
1    Yasir   27  Abbottabad
2    Usman   18    Havelian
In this example Python code, we first created a simple Python dictionary. Then we used the data frame function and passed this dictionary to it. The keys were used as column names and the values were assigned to their specific columns.
Accessing values from Python Dataframe
print( df.head() )
print( df.tail(2) )
print( df[['Age', 'Name']] )
print( df['City'] )
Output
- The first example will show the first 5 rows by default, but we can customize it.
- The second example will show the bottom 2 row as specified.
- In the third example, we specified which columns we want by specifying their names inside the list.
- In the fourth example code, we can see that we can easily access only one column as well.
Missing Data Handling
data= {'Name': ['Zeeshan','Yasir',None],
'Age': [None,27,None],
'City': ['Havelian',None,None]}

df= pd.DataFrame(data)

val='empty'

df.dropna()         # It will drop rows having missing values
print(df)

df.fillna(val)      # It will replace the missing values with a specific data
print(df)

df.interpolate()   # interpolation of missing values in done by this method
print(df)
Output
      Name   Age      City
0  Zeeshan   NaN  Havelian
1    Yasir  27.0      None
2     None   NaN      None
      Name   Age      City
0  Zeeshan   NaN  Havelian
1    Yasir  27.0      None
2     None   NaN      None
      Name   Age      City
0  Zeeshan   NaN  Havelian
1    Yasir  27.0      None
2     None   NaN      None
Manipulating Data
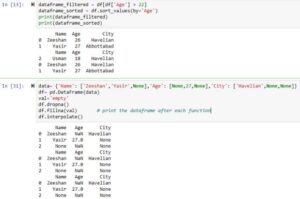
dataframe_filtered = df[df['Age'] > 22]
dataframe_sorted = df.sort_values(by='Age')
print(dataframe_filtered)
print(dataframe_sorted)
Output
      Name  Age        City
0  Zeeshan   26    Havelian
1    Yasir   27  Abbottabad

      Name  Age        City
2    Usman   18    Havelian
0  Zeeshan   26    Havelian
1    Yasir   27  Abbottabad
In the first example, we apply conditions that take only those rows in which ‘age’ is greater than 22. In the second example, we sort the data frame by column ‘age’.
Images of Code Examples
Conclusion
In conclusion, hope you now have an understanding of what the Python pandas library is and how it works. We’ve specified some functions that we can use with the help of the Pandas library. In our other articles, we’ve discussed the pandas Series and pandas data frame in more detail and with code examples, so do visit them as well.
Do visit our other articles to practically implement Python pandas with proper code examples. Thank you for reading this article.
